Healthcare Flu Shots
A Tableau Dashboard visualizing flu shots loaded from SQL data. 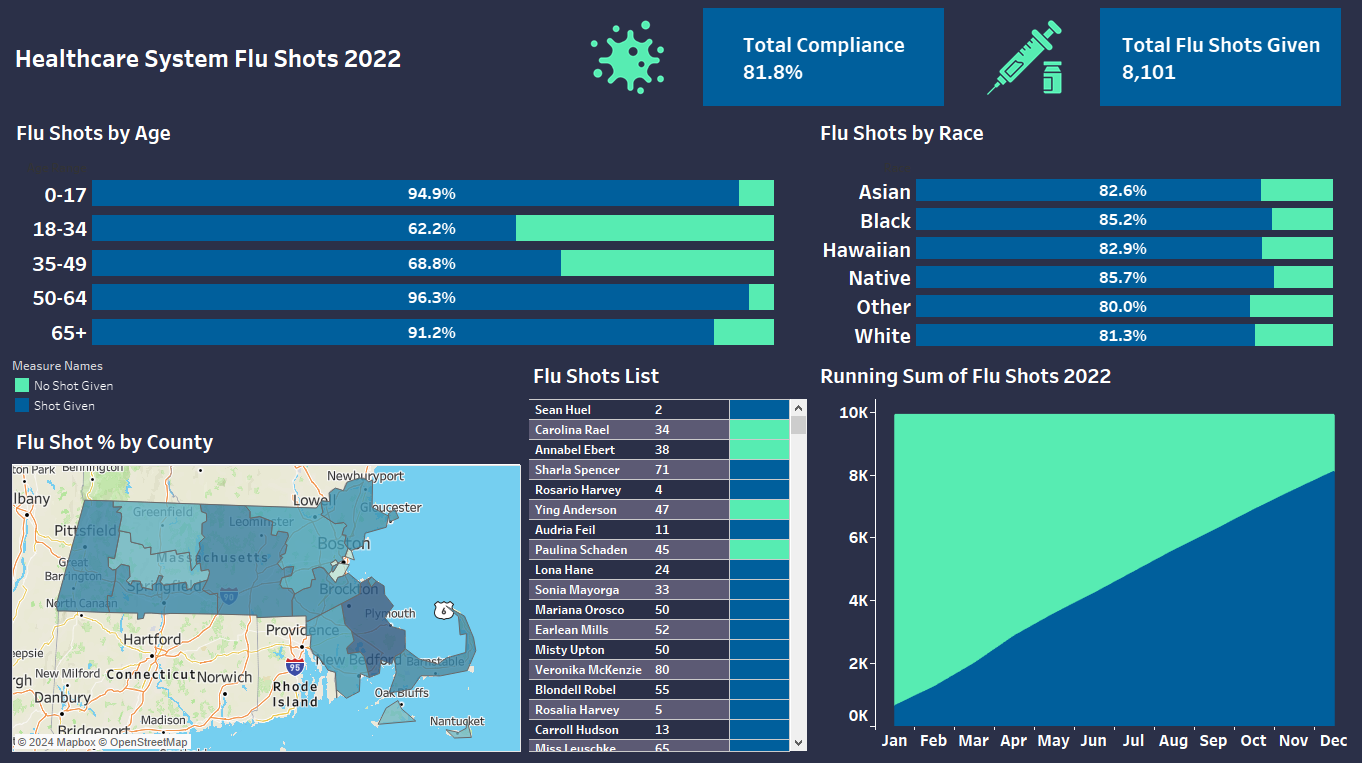
This data, obtained from the Data-Wizardy GitHub, was stored and managed using PostgreSQL which was then imported into Tableau for visualization, where it was carefully cleaned, prepared, and presented in an interactive dashboard focusing on the 2022 Flu Shots in Massachusetts. The dashboard allows uses to filter information by county, age group, and race.
Try the interactive Tableau version here.